Information in this document, including URL and other Internet Web site references, is subject to change without notice. Unless otherwise noted, the example companies, organizations, products, domain names, e-mail addresses, logos, people, places, and events depicted herein are fictitious, and no association with any real company, organization, product, domain name, e-mail address, logo, person, place or event is intended or should be inferred. Complying with all applicable copyright laws is the responsibility of the user. Without limiting the rights under copyright, no part of this document may be reproduced, stored in or introduced into a retrieval system, or transmitted in any form or by any means (electronic, mechanical, photocopying, recording, or otherwise), or for any purpose, without the express written permission of Microsoft Corporation.
Microsoft may have patents, patent applications, trademarks, copyrights, or other intellectual property rights covering subject matter in this document. Except as expressly provided in any written license agreement from Microsoft, the furnishing of this document does not give you any license to these patents, trademarks, copyrights, or other intellectual property.
The names of manufacturers, products, or URLs are provided for informational purposes only and Microsoft makes no representations and warranties, either expressed, implied, or statutory, regarding these manufacturers or the use of the products with any Microsoft technologies. The inclusion of a manufacturer or product does not imply endorsement of Microsoft of the manufacturer or product. Links may be provided to third party sites. Such sites are not under the control of Microsoft and Microsoft is not responsible for the contents of any linked site or any link contained in a linked site, or any changes or updates to such sites. Microsoft is not responsible for webcasting or any other form of transmission received from any linked site. Microsoft is providing these links to you only as a convenience, and the inclusion of any link does not imply endorsement of Microsoft of the site or the products contained therein.
If you have not yet completed the steps to set up your environment in Before the hands-on lab setup guide, you will need to do that before proceeding.
Abstract and learning objectives
In this hands-on lab, you will construct an end-to-end IoT solution simulating high velocity data emitted from smart meters and analyzed in Azure. You will design a lambda architecture, filtering a subset of the telemetry data for real-time visualization on the hot path, and storing all the data in long-term storage for the cold path.
At the end of this hands-on lab, you will be better able to build an IoT solution implementing device registration with the IoT Hub Device Provisioning Service and visualizing hot data with Power BI.
Overview
Fabrikam provides services and smart meters for enterprise energy (electrical power) management. Their You-Left-The-Light-On service enables the enterprise to understand their energy consumption.
Solution architecture
Below is a diagram of the solution architecture you will build in this lab. Please study this carefully, so you understand the whole of the solution as you are working on the various components.
Diagram of the preferred solution described in the next paragraph.
Smart Meters are installed in buildings. They will register with a Device Provisioning Service using an attestation method through an enrollment group. Once registered and connected, messages are ingested from the Smart Meters via the IoT Hub that the Device Provisioning Service assigned to the device. A Stream Analytics job pulls telemetry messages from IoT Hub and sends the messages to two different destinations. There are two Stream Analytics jobs, one that retrieves all messages and sends them to Blob Storage (the cold path), and another that selects out only the important events needed for reporting in real time (the hot path). Data entering the hot path will be reported on using Power BI visualizations and reports. For the cold path, Azure Databricks can be used to apply the batch computation needed for the reports at scale.
Other alternatives for processing of the ingested telemetry would be to use an HDInsight Storm cluster, a WebJob running the EventProcessorHost in place of Stream Analytics, or HDInsight running with Spark streaming. Depending on the type of message filtering being conducted for hot and cold stream separation, IoT Hub Message Routing might also be used, but this has the limitation that messages follow a single path, so with the current implementation, it would not be possible to send all messages to the cold path, while simultaneously sending some of the same messages into the hot path. An important limitation to keep in mind for Stream Analytics is that it is very restrictive on the format of the input data it can process: the payload must be UTF8 encoded JSON, UTF8 encoded CSV (fields delimited by commas, spaces, tabs, or vertical pipes), or AVRO, and it must be well-formed. If any devices transmitting telemetry cannot generate output in these formats (e.g., because they are legacy devices), or their output can be not well formed at times, then alternatives that can better deal with these situations should be investigated. Additionally, any custom code or logic cannot be embedded with Stream Analytics—if greater extensibility is required, the alternatives should be considered.
Note: The preferred solution is only one of many possible, viable approaches.
Requirements
Microsoft Azure subscription must be pay-as-you-go or MSDN.
Trial subscriptions will not work.
A virtual machine configured with:
Visual Studio Community 2019 or later
Azure SDK 2.9 or later (Included with Visual Studio)
Exercise 1: IoT Hub and Device Provisioning Service deployment
Duration: 30 minutes
In your architecture design session with Fabrikam, it was agreed upon to use Azure Device Provisioning Service (DPS) to manage automatic device registration. The DPS would then assign an IoT Hub to the device that ingests telemetry from the Smart Meter Simulator. In this exercise, you will deploy an IoT Hub and DPS to enable device registration and connectivity.
Task 1: Provision the IoT Hub
In these steps, you will provision an instance of IoT Hub.
In your browser, navigate to the Azure portal, select +Create a resource in the navigation pane, enter IoT Hub into the Search the Marketplace box, and select IoT Hub from the results.
“IoT Hub” is entered into the Search the Marketplace box. IoT Hub is highlighted in the search results.
On the resource overview page, select Create.
On the IoT Hub screen, Basics tab, enter the following:
Subscription: Select the subscription you are using for this hands-on lab.
Resource group: Choose Use existing and select the hands-on-lab-SUFFIX resource group.
Region: Select the location you are using for this hands-on lab.
IoT Hub Name: Enter a unique name, such as smartmeter-hub-SUFFIX.
The Basics tab for IoT Hub is displayed, with the values specified above entered into the appropriate fields.
Select the Management tab. Accept the default Pricing and scale tier of S1: Standard tier and select Review + create.
The Management tab for IoT Hub is displayed with the Standard pricing tier selected.
Once validation has passed, select Create.
When the IoT Hub deployment is completed, you will receive a notification in the Azure portal. Select Go to resource in the notification.
Screenshot of the Deployment succeeded message, with the Go to resource button highlighted.
From the IoT Hub’s Overview blade, select Shared access policies under Settings on the left-hand menu.
Screenshot of the Overview blade, settings section. Under Settings, Shared access policies is highlighted.
Select iothubowner policy.
The Azure portal is shown with the iothubowner selected.
In the iothubowner blade, select the Copy button to the right of the Connection string - primary key field. Record this value for a future task.
Screenshot of the iothubowner blade. The connection string - primary key field is highlighted.
Task 2: Deploy the Device Provisioning Service
In these steps, you will deploy an instance of the Device Provisioning Service (DPS).
In your browser, navigate to the Azure portal, select +Create a resource in the navigation pane, enter IOT Hub Device Provisioning Service into the Search the Marketplace box, and select IoT Hub from the results.
The Search the Marketplace textbox is shown with IoT Hub Device Provisioning Service entered as the search criteria and is selected from the search results.
On the resource overview page, select Create.
On the IoT Hub device provisioning service Basics tab, complete the form as follows:
Subscription: Select the subscription you are using for this hands-on lab.
Resource group: Choose Use existing and select the hands-on-lab-SUFFIX resource group.
Name: Enter a unique name, such as smartmeter-dps-SUFFIX.
Region: Select the location you are using for this hands-on lab.
The DPS creation form Basics tab is shown populated with the above values.
Select Review + create, then once validation has passed, select Create once more to deploy the service.
When the DPS deployment is completed, select Go to resource on the deployment screen.
On the Overview screen of the Device Provisioning Service, copy and record the value for ID Scope for a future task.
The DPS Overview screen displays with the ID Scope field highlighted.
Task 3: Link the IoT Hub to the Device Provisioning Service
Remaining in the DPS resource, select Linked IoT hubs from the left menu, located beneath the Settings heading. Then select +Add from the toolbar.
The DPS Linked IoT hubs screen is shown with Linked IoT hubs selected in the left menu and the +Add button highlighted in the toolbar.
In the Add link to IoT hub blade, populate the form as follows, then select Save:
Subscription: Select the subscription you are using for this hands-on lab.
IoT Hub: Select the smartmeter-hub-{SUFFIX} IoT Hub.
Access Policy: Select iothubowner.
The Add link to IoT hub blade is shown populated with the preceding values.
Task 4: Create an enrollment group
Creating an enrollment group enables Fabrikam to allow devices to self-register. This avoids the need to register each device manually. Group enrollments are made possible via secure Attestations, these could be via certificates or symmetric keys. In this example, we will use the symmetric key approach. Using symmetric keys should only be used in non-production scenarios, such as with this proof of concept.
Remaining in the DPS resource, select Manage enrollments from the left menu, then select +Add enrollment group from the toolbar menu.
The DPS Manage enrollments screen displays with the Manage enrollments item selected from the left menu and the +Add enrollment group button highlighted on the toolbar.
In the Add Enrollment Group form, populate it as follows, then select the Save button.
Group name: Enter smartmeter-device-group.
Attestation Type: Select Symmetric Key.
Auto-generate keys: Checked.
IoT Edge device: Select False.
Select how you want to assign devices to hubs: Select Evenly weighted distribution.
Select the IoT hubs this group can be assigned to: Select smartmeter-hub-{SUFFIX}.azure-devices.net.
Select how you want the device data to be handled on re-provisioning: Select Re-provision and migrate data.
Initial Device Twin State: Retain the default value.
Enable entry: Select Enable.
The Add Enrollment Group form is shown populated with the preceding values.
Select the newly created enrollment group from the Enrollment Groups list.
On the Enrollment Group Details screen, copy the Primary Key value and record it for a future task.
The Enrollment Group Details screen is shown with the copy button highlighted next to the Primary Key field.
Exercise 2: Completing the Smart Meter Simulator
Duration: 60 minutes
Fabrikam has left you a partially completed sample in the form of the Smart Meter Simulator solution. You will need to complete the missing lines of code that deal with device registration management and device telemetry transmission that communicate with your IoT Hub.
Task 1: Implement device management with the IoT Hub
In Visual Studio on your Lab VM, use Solution Explorer to open the file DeviceManager.cs.
From the Visual Studio View menu, choose Task List.
On the Visual Studio View menu, Task List is selected.
In the Task List, you will see a list of TODO tasks, where each task represents one line of code that needs to be completed. Complete the line of code below each TODO using the code below as a reference. If your task list is blank, complete TODO steps 1-5 as indicated in the code in the next step.
Note: Sometimes the Task List will not populate, this will not impact completing this lab.
The following code represents the completed tasks in DeviceManager.cs:
 using System;
 using System.Security.Cryptography;
 using System.Text;
 using System.Threading.Tasks;
 using Microsoft.Azure.Devices.Provisioning.Client;
 using Microsoft.Azure.Devices.Provisioning.Client.Transport;
 using Microsoft.Azure.Devices.Shared;

 namespace SmartMeterSimulator
 {
     class DeviceManager
     {
         /// <summary>
         /// Register a single device with the device provisioning service.
         /// </summary>
         /// <param name="enrollmentKey">Group Enrollment Key</param>
         /// <param name="idScope">DPS Service ID Scope</param>
         /// <param name="deviceId">Device Id of the device being registered</param>
         /// <returns></returns>
         public async static Task<SmartMeterDevice> RegisterDeviceAsync(string enrollmentKey, string idScope, string deviceId)
         {
             var globalEndpoint = "global.azure-devices-provisioning.net";
             SmartMeterDevice device = null;

             //TODO: 1. Derive a device key from a combination of the group enrollment key and the device id
             var primaryKey = ComputeDerivedSymmetricKey(enrollmentKey, deviceId);

             //TODO: 2. Create symmetric key with the generated primary key
             using (var security = new SecurityProviderSymmetricKey(deviceId, primaryKey, null))
             using (var transportHandler = new ProvisioningTransportHandlerMqtt())
             {
                 //TODO: 3. Create a Provisioning Device Client
                 var client = ProvisioningDeviceClient.Create(globalEndpoint, idScope, security, transportHandler);

                 //TODO: 4. Register the device using the symmetric key and MQTT
                 DeviceRegistrationResult result = await client.RegisterAsync();

                 //TODO: 5. Populate the device provisioning details
                 device = new SmartMeterDevice()
                 {
                     AuthenticationKey = primaryKey,
                     DeviceId = deviceId,
                     IoTHubHostName = result.AssignedHub
                 };
             }

             //return the device
             return device;
         }

         /// <summary>
         /// Compute a symmetric key for the provisioned device from the enrollment group symmetric key used in attestation.
         /// </summary>
         /// <param name="enrollmentKey">Enrollment group symmetric key.</param>
         /// <param name="deviceId">The device Id of the key to create.</param>
         /// <returns>The key for the specified device Id registration in the enrollment group.</returns>
         /// <seealso>
         /// https://docs.microsoft.com/en-us/azure/iot-edge/how-to-auto-provision-symmetric-keys?view=iotedge-2018-06#derive-a-device-key
         /// </seealso>
         private static string ComputeDerivedSymmetricKey(string enrollmentKey, string deviceId)
         {
             if (string.IsNullOrWhiteSpace(enrollmentKey))
             {
                 return enrollmentKey;
             }

             var key = "";
             using (var hmac = new HMACSHA256(Convert.FromBase64String(enrollmentKey)))
             {
                 key = Convert.ToBase64String(hmac.ComputeHash(Encoding.UTF8.GetBytes(deviceId)));
             }

             return key;
         }
     }

 }
Note: Be sure you only replace code in the DeviceManager class and not any other code in the file.
Save DeviceManager.cs.
Task 2: Configure the DPS Group Enrollment Key and ID Scope
You will want to avoid entering the DPS Group Enrollment Key and ID Scope every time the project is run. To do this, you can set this value as the default text for the DPS Group Enrollment Primary Key and DPS ID Scope text boxes in the application. Follow these steps to configure the connection string:
Return to the SmartMeterSimulator solution in Visual Studio on your Lab VM.
In the Solution Explorer, expand the SmartMeterSimulator project and double-click MainForm.cs to open it. (If the Solution Explorer is not in the upper-right corner of your Visual Studio instance, you can find it under the View menu in Visual Studio.)
In the Visual Studio Solution Explorer window, SmartMeterSimulator project is expanded, and under it, MainForm.cs is highlighted.
Note: If the file does not open. One of the project files may be blocked.
Open Windows Explorer and navigate to the starter project folder: **C:-on lab-files-project*.
Right-click on the MainForm.resx file, then select Properties.
Check the Unblock checkbox on the bottom of the General tab, then select Apply then OK.
Right-click MainForm.resx, go to Properties, then check the box next to Unblock
Close and reopen Visual Studio. Re-open the MainForm.cs file.
Note: If you are still unable to see the Windows Forms designer, close it, then right-click the project and select Clean. Then, right-click the project again and select Build. Now, you should be able to open the form without a problem.
Building and cleaning the solution to ensure that the Windows Forms editor shows up.
In the Windows Forms designer surface, select the DPS Group Enrollment Primary Key textbox.
The Windows Form designer surface is opened to the MainForm.cs tab. The DPS Group Enrollment Primary Key textbox is highlighted, but is empty.
In the Properties panel, scroll until you see the Text property. Paste your DPS Enrollment Group Primary Key value copied from Exercise 1, Task 4, Step 4 into the value for the Text property. (If the properties window is not visible below the Solution Explorer, right-click the TextBox, and select Properties.)
In the Properties panel, the Text property is highlighted, and is populated.
Repeat steps 3 and 4 to populate the DPS ID Scope textbox with the value you recorded in Exercise 1, Task 2, Step 6.
Your DPS Group Enrollment Primary Key and ID Scope should now be present every time you run the Smart Meter Simulator.
The Windows Form designer surface is opened to the MainForm.cs tab. The IoT Hub Connection String now displays.
Save MainForm.cs.
Task 3: Implement the communication of telemetry with IoT Hub
Open Sensor.cs from the Solution Explorer and complete the TODO items 6 to 11 as indicated within the code that are responsible for transmitting telemetry data to the IoT Hub, as well as receiving data from IoT Hub.
The following code shows the completed result:
 using System;
 using System.Text;
 using Microsoft.Azure.Devices.Client;
 using Newtonsoft.Json;


 namespace SmartMeterSimulator
 {
     /// <summary>
     /// A sensor represents a Smart Meter in the simulator.
     /// </summary>
     class Sensor
     {
         private DeviceClient DeviceClient;
         private string IotHubUri { get; set; }
         public string DeviceId { get; set; }
         public string DeviceKey { get; set; }
         public DeviceState State { get; set; }
         public string StatusWindow { get; set; }
         public string ReceivedMessage { get; set; }
         public double? ReceivedTemperatureSetting { get; set; }
         public double CurrentTemperature
         {
             get
             {
                 double avgTemperature = 70;
                 Random rand = new Random();
                 double currentTemperature = avgTemperature + rand.Next(-6, 6);

                 if (ReceivedTemperatureSetting.HasValue)
                 {
                     // If we received a cloud-to-device message that sets the temperature, override with the received value.
                     currentTemperature = ReceivedTemperatureSetting.Value;
                 }

                 if (currentTemperature <= 68)
                     TemperatureIndicator = SensorState.Cold;
                 else if (currentTemperature > 68 && currentTemperature < 72)
                     TemperatureIndicator = SensorState.Normal;
                 else if (currentTemperature >= 72)
                     TemperatureIndicator = SensorState.Hot;

                 return currentTemperature;
             }
         }
         public SensorState TemperatureIndicator { get; set; }

         public Sensor(string deviceId)
         {
             DeviceId = deviceId;

         }

         public void SetRegistrationInformation(string iotHubUri, string deviceKey)
         {
             IotHubUri = iotHubUri;
             DeviceKey = deviceKey;
             State = DeviceState.Registered;
         }
         public void InstallDevice(string statusWindow)
         {
             StatusWindow = statusWindow;
             State = DeviceState.Installed;
         }

         /// <summary>
         /// Connect a device to the IoT Hub by instantiating a DeviceClient for that Device by Id and Key.
         /// </summary>
         public void ConnectDevice()
         {
             //TODO: 6. Connect the Device to Iot Hub by creating an instance of DeviceClient
             DeviceClient = DeviceClient.Create(IotHubUri, new DeviceAuthenticationWithRegistrySymmetricKey(DeviceId, DeviceKey));

             //Set the Device State to Ready
             State = DeviceState.Connected;
         }

         public void DisconnectDevice()
         {
             //Delete the local device client
             DeviceClient = null;

             //Set the Device State to Activate
             State = DeviceState.Registered;
         }

         /// <summary>
         /// Send a message to the IoT Hub from the Smart Meter device
         /// </summary>
         public async void SendMessageAsync()
         {
             var telemetryDataPoint = new
             {
                 id = DeviceId,
                 time = DateTime.UtcNow.ToString("o"),
                 temp = CurrentTemperature
             };

             //TODO: 7.Serialize the telemetryDataPoint to JSON
             var messageString = JsonConvert.SerializeObject(telemetryDataPoint);

             //TODO: 8.Encode the JSON string to ASCII as bytes and create new Message with the bytes
             var message = new Message(Encoding.ASCII.GetBytes(messageString));

             //TODO: 9.Send the message to the IoT Hub
             var sendEventAsync = DeviceClient?.SendEventAsync(message);
             if (sendEventAsync != null) await sendEventAsync;
         }

         /// <summary>
         /// Check for new messages sent to this device through IoT Hub.
         /// </summary>
         public async void ReceiveMessageAsync()
         {
             if (DeviceClient == null)
                 return;

             try
             {
                 Message receivedMessage = await DeviceClient?.ReceiveAsync();
                 if (receivedMessage == null)
                 {
                     ReceivedMessage = null;
                     return;
                 }

                 //TODO: 10.Set the received message for this sensor to the string value of the message byte array
                 ReceivedMessage = Encoding.ASCII.GetString(receivedMessage.GetBytes());
                 if (double.TryParse(ReceivedMessage, out var requestedTemperature))
                 {
                     ReceivedTemperatureSetting = requestedTemperature;
                 }
                 else
                 {
                     ReceivedTemperatureSetting = null;
                 }

                 // Send acknowledgement to IoT Hub that the has been successfully processed.
                 // The message can be safely removed from the device queue. If something happened
                 // that prevented the device app from completing the processing of the message,
                 // IoT Hub delivers it again.

                 //TODO: 11.Send acknowledgement to IoT hub that the message was processed
                 await DeviceClient?.CompleteAsync(receivedMessage);
             }
             catch (Exception)
             {
                 // The device client is null, likely due to it being disconnected since this method was called.
                 System.Diagnostics.Debug.WriteLine("The DeviceClient is null. This is likely due to it being disconnected since the ReceiveMessageAsync message was called.");
             }
         }
     }


     public enum DeviceState
     {
         New,
         Installed,
         Registered,
         Connected,
         Transmit
     }
     public enum SensorState
     {
         Cold,
         Normal,
         Hot
     }
 }
Note: Be sure you only replace the Sensor class and not any other code in the file.
Save Sensor.cs.
Task 4: Verify device registration and telemetry
In this task, you will build and run the Smart Meter Simulator project.
In Visual Studio select Build from the Visual Studio menu, then select Build Solution.
Run the Smart Meter Simulator, by selecting the green Start button on the Visual Studio toolbar.
The green Start button is highlighted on the Visual Studio toolbar.
Select one or more of the windows within the building to simulate the installation of a smart meter device. Once selected, the window will turn yellow.
The smart meter simulator displays with three windows in yellow.
Select Register on the Smart Meter Simulator window, this triggers the smart meter automatic registration through the enrollment group. It will take a few seconds for each of the yellow (installed) windows to turn to cyan, indicating the device is registered.
The smart meter simulator window is shown with the previously yellow windows now displaying as cyan.
At this point, you have installed and registered one or more devices (in cyan). To view this list of devices, you will switch over to the Azure Portal, and open the IoT Hub you provisioned.
From the IoT Hub blade, select IoT Devices under Explorers on the left-hand menu.
On the IoT Hub blade, in the Explorers section, under Explorers, IoT Devices is highlighted.
You should see the selected devices listed having a status of Enabled.
Devices in the Device ID list have a status of either enabled or disabled.
In the Azure Portal, open the Device Provisioning Service resource, then select Manage enrollments from the left menu. Select the smartmeter-device-group enrollment group.
The DPS Manage enrollments screen is shown with Manage enrollments selected in the left menu and the smartmeter-device-group highlighted in the enrollment groups listing.
In the Enrollment Group Details screen, select the Registration Records tab and notice the devices selected for registration in the simulator application are listed.
The DPS Enrollment Group Details screen displays with the Registration Records tab highlighted and a list of registered devices.
Return to the Smart Meter Simulator window.
Select Connect. Within a few moments, you should begin to see activity as the windows change color, indicating the smart meters are transmitting telemetry. The grid on the left will list each telemetry message transmitted and the simulated temperature value.
On the Smart Meter Simulator, the Connect button is highlighted, and one of the green windows has now turned to blue. The current windows count is now seven gray, two green, and one blue.
Allow the smart meter to continue to run for the duration of the lab.
Exercise 3: Hot path data processing with Stream Analytics
Duration: 45 minutes
Fabrikam would like to visualize the “hot” data showing the average temperature reported by each device over a 5-minute window in Power BI.
Task 1: Create a Stream Analytics job for hot path processing to Power BI
In the Azure Portal, expand the left menu and select + Create a resource, enter stream analytics into the Search the Marketplace box, select Stream Analytics job from the results, and select Create.
In the Azure Portal, +Create a resource is highlighted, “stream analytics” is entered into the Search the Marketplace box, and Stream Analytics job is highlighted in the results.
On the New Stream Analytics Job form, enter the following:
Job name: Enter hot-stream.
Subscription: Select the subscription you are using for this hands-on lab.
Resource group: Choose Use existing and select the hands-on-lab-SUFFIX resource group.
Location: Select the location you are using for resources in this hands-on lab.
Hosting environment: Select Cloud.
Streaming units: Change the value to 1 by sliding the slider all the way left.
The New Stream Analytics Job form is displayed, with the previously mentioned settings entered into the appropriate fields.
Select Create.
Once provisioned, navigate to your new Stream Analytics job in the portal.
On the Stream Analytics job blade, select Inputs from the left-hand menu, under Job Topology, then select +Add stream input, and select IoT Hub from the dropdown menu to add an input connected to your IoT Hub.
On the Stream Analytics job blade, Inputs is selected under Job Topology in the left-hand menu, and +Add stream input is highlighted in the Inputs blade, and IoT Hub is highlighted in the drop down menu.
On the New Input blade, enter the following:
Input alias: Enter temps.
Choose Select IoT Hub from your subscriptions.
Subscription: Select the subscription you are using for this hands-on lab.
IoT Hub: Select the smartmeter-hub-SUFFIX IoT Hub.
Consumer Group: Leave set to $Default.
Shared access policy name: Select service.
Endpoint: Select Messaging.
Partition Key: Leave empty.
Event serialization format: Select JSON.
Encoding: Select UTF-8.
Event compression type: Leave set to None.
IoT Hub New Input blade is displayed with the values specified above entered into the appropriate fields.
Select Save.
Next, select Outputs from the left-hand menu, under Job Topology, and select + Add, then select Power BI from the drop-down menu.
Outputs is highlighted in the left-hand menu, under Job Topology, +Add is selected, and Power BI is highlighted in the drop down menu.
In the Power BI blade, select Authorize to authorize the connection to your Power BI account. When prompted in the popup window, enter the account credentials you used to create your Power BI account in Before the hands-on lab setup guide, Task 1.
The Authorize connection message is displayed and the Authorize button is highlighted.
Once authorized, enter the following:
Output alias: Set to powerbi
Group Workspace: Select the default, My workspace.
Authentication mode: Select User token.
Dataset Name: Enter avgtemps
Table Name: Enter avgtemps
Power BI blade. Output alias is powerbi, dataset name is avgtemps, table name is avgtemps, authentication mode is User token.
Select Save.
Next, select Query from the left-hand menu, under Job Topology.
Under Job Topology, Query is selected.
In the Query text box, paste the following query.
SELECT AVG(temp) AS Average, id
INTO powerbi
FROM temps
GROUP BY TumblingWindow(minute, 5), id
Select Save query.
Save button on the Query blade is highlighted
Return to the Overview blade on your Stream Analytics job and select Start.
The Start button is highlighted on the Overview blade.
In the Start job blade, select Now (the job will start processing messages from the current point in time onward).
Now is selected on the Start job blade.
Select Start.
Allow your Stream Analytics Job a few minutes to start.
Once the Stream Analytics Job has successfully started, verify that you are showing a non-zero amount of Input Events on the Monitoring chart on the Overview blade. You may need to reconnect your devices on the Smart Meter Simulator and let it run for a while to see the events.
The Stream Analytics job monitoring chart is displayed with a non-zero amount of input events highlighted.
Task 2: Visualize hot data with Power BI
Sign into your Power BI subscription (https://app.powerbi.com) to see if data is being collected.
Select My Workspace on the left-hand menu, then select the Datasets + dataflows tab, and locate the avgtemps dataset from the list.
Note: Sometimes it takes few minutes for the dataset to appear in the Power BI Dataset tab under My Workspace
On the Power BI window, My Workspace is highlighted in the left pane, and the Datasets tab is highlighted in the right pane, and the avgtemps dataset is highlighted.
Select the Create Report button under the Actions menu.
On the Datasets tab, under Actions, the Create Report button is highlighted.
On the Visualizations palette, select Stacked column chart to create a chart visualization.
On the Visualizations palette, the stacked column chart icon is highlighted.
In the Fields listing, drag the id field, and drop it into the Axis field.
Under Fields, an arrow points from the id field under avgtemps, to the same id field now located in the Visualizations listing, under Axis.
Next, drag the Average field and drop it into the Values field.
Under Fields, an arrow points from the average field under avgtemps, to the same Average field now located in the Visualizations listing, under Values.
Now, set the Values to Max of average, by selecting the down arrow next to Average, and select Maximum.
On the Value drop-down list, Maximum is highlighted.
Repeat steps 4-7, this time adding a Stacked Column Chart for Min of average. (You may need to select on any area of white space on the report designer surface to deselect the Max of average by id chart visualization.)
Min of average is added under Value.
Next, add a table visualization.
On the Visualizations palette, the table icon is highlighted.
Set the values to id and Average of Average, by dragging and dropping both fields in the Values field, then selecting the dropdown next to Average, and selecting Average.
ID and Average of average now display under Values.
Under the File menu, select to Save the report.
Under File, Save is highlighted.
Enter the name Average Temperatures and select Save.
The report name is set to Average Temperatures.
Within the report, select one of the columns to see the data for just that device.
The report window has two bar graphs: Max of average by id, and Min of average by id. Both bar charts list data for Device0, Device1, Device3, Device8, and Device9. Device1 is selected. Below the bar charts, a table displays data for Device1, with an Average of average value of 68.61.
Exercise 4: Cold path data processing with Azure Databricks
Duration: 60 minutes
Fabrikam would like to be able to capture all the “cold” data into scalable storage so that they can summarize it periodically using a Spark SQL query.
Task 1: Create a Storage account
In the Azure portal, select + Create a resource, enter storage account into the Search the Marketplace box, select Storage account from the results, and select Create.
“storage account” is entered into the Search the Marketplace box, and Storage account is highlighted in the results.
In the Create storage account on the Basics tab, enter the following:
Subscription: Select the subscription you are using for this hands-on lab.
Resource group: Choose Use existing and select the hands-on-lab-SUFFIX resource group.
Storage account name: Enter smartmetersSUFFIX.
Location: Select the location you are using for resources in this hands-on lab.
The Create storage account blade is displayed, with the previously mentioned settings entered into the appropriate fields.
Select the Advanced tab, verify the following:
Require secure transfer for REST API operations: Unchecked.
The Create storage account blade is displayed with options under the Advanced tab.
Select Review + create.
Once validation has passed, select Create.
Once provisioned, navigate to your storage account, select Access keys from the left-hand menu, select Show keys from the top toolbar, then copy the key1 Key value into a text editor, such as Notepad, for later use.
The Access Keys blade is displayed with the key1 copy button is highlighted.
Task 2: Create the Stream Analytics job for cold path processing
To capture all metrics for the cold path, set up another Stream Analytics job that will write all events to Blob storage for analysis with Azure Databricks.
In the Azure Portal, select + Create a resource, enter stream analytics job into the Search the Marketplace box, select Stream Analytics job from the results, and select Create.
In the Azure Portal, +Create a resource is highlighted, “stream analytics” is entered into the Search the Marketplace box, and Stream Analytics job is highlighted in the results.
On the New Stream Analytics Job blade, enter the following:
Job name: Enter cold-stream.
Subscription: Select the subscription you are using for this hands-on lab.
Resource group: Select the hands-on-lab-SUFFIX resource group.
Location: Select the location you are using for resources in this hands-on lab.
Hosting environment: Select Cloud.
Streaming units: Drag the slider all the way to the left to select 1 streaming unit.
The New Stream Analytics Job blade is displayed, with the previously mentioned settings entered into the appropriate fields.
Select Create.
Once provisioned, navigate to your new Stream Analytics job in the portal.
On the Stream Analytics job blade, select Inputs from the left-hand menu, under Job Topology, then select +Add stream input, and select IoT Hub from the dropdown menu to add an input connected to your IoT Hub.
On the Stream Analytics job blade, Inputs is selected under Job Topology in the left-hand menu, and +Add stream input is highlighted in the Inputs blade, and IoT Hub is highlighted in the drop down menu.
On the New Input blade, enter the following:
Input alias: Enter iothub.
Choose Select IoT Hub from your subscriptions.
Subscription: Select the subscription you are using for this hands-on lab.
IoT Hub: Select the smartmeter-hub-SUFFIX IoT Hub.
Consumer Group: Leave set to $Default.
Shared access policy name: Select service.
Endpoint: Select Messaging.
Partition key: Keep empty.
Event serialization format: Select JSON.
Encoding: Select UTF-8.
Event compression type: Leave set to None.
IoT Hub New Input blade is displayed with the values specified above entered into the appropriate fields.
Select Save.
Next, select Outputs from the left-hand menu, under Job Topology, and select + Add, then select Blob storage/ADLS Gen2 from the drop-down menu.
Outputs is highlighted in the left-hand menu, under Job Topology, +Add is selected, and Blob storage is highlighted in the drop down menu.
On the Blob storage output blade, enter the following:
Output alias: Set to blobs.
Choose Select blob storage from your subscriptions.
Subscription: Select the subscription you are using for this hands-on lab.
Storage account: Select the smartmetersSUFFIX storage account you created in the previous task.
Container: Choose Create new and enter smartmeters
Authentication mode: Select Connection string.
Path pattern: Enter smartmeters/{date}/{time}
Date format: Select YYYY-DD-MM.
Time format: Select HH.
Event serialization format: Select CSV, comma (,)
Encoding: Select UTF-8.
Minimum rows: Enter 100.
Maximum time: Enter 5 Minutes.
Blob storage New output blade is displayed, with the values mentioned above entered into the appropriate fields.
Select Save.
Next, select Query from the left-hand menu, under Job Topology.
Under Job Topology, Query is selected.
In the Query text box, paste the following query.
SELECT
      *
INTO
      blobs
FROM
      iothub
Select Save query, and Yes when prompted with the confirmation.
Save button on the Query blade is highlighted
Return to the Overview blade on your Stream Analytics job and select Start.
The Start button is highlighted on the Overview blade.
In the Start job blade, select Now (the job will start processing messages from the current point in time onward).
Now is selected on the Start job blade.
Select Start.
Allow your Stream Analytics Job a few minutes to start.
Once the Stream Analytics Job has successfully started, verify that you are showing a non-zero amount of Input Events on the Monitoring chart on the Overview blade. You may need to reconnect your devices on the Smart Meter Simulator and let it run for a while to see the events.
The Stream Analytics job monitoring chart is diplayed with a non-zero amount of input events highlighted.
Task 3: Verify CSV files in blob storage
In this task, we are going to verify that the CSV file is being written to blob storage.
Note: This can be done via Visual Studio or using the Azure portal. For this lab, we will perform the task using Visual Studio.
Within Visual Studio on your Lab VM, select the View menu, then select Cloud Explorer.
On the Visual Studio View menu, Cloud Explorer is highlighted.
In Cloud Explorer, select Account Management, and connect to your Microsoft Azure Subscription.
The Cloud Explorer window displays, and the Account management icon is highlighted.
If prompted, sign into your Azure account.
Allow Cloud Explorer about 30 seconds to load your subscription resources.
Expand your Azure subscription, then expand Storage Accounts, expand the smartmetersSUFFIX storage account, then expand the Blob containers node, then right-click the smartmeters container, and select Open. It may take a few moments to load your storage accounts.
Storage accounts is expanded in the Visual Studio Cloud Explorer, with the smartmetersSUFFIX account is expanded, and the Open menu item highlighted for the smartmeters container.
Verify files are being written to Blob storage (the files should be located underneath the smartmeters container).
Files are listed in the blob storage account, as written by the cold path route in IoT Hub Messaging.
Task 4: Process with Spark SQL
In this task, you will create a new Databricks notebook to perform some processing and visualization of the cold path data using Spark.
Note: The complete Databricks notebook can be found in the Databricks-notebook folder of the GitHub repo associated with this hands-on lab, should you need to reference it for troubleshooting.
On the Azure Databricks Service blade, the Launch Workspace button is highlighted.
On the Azure Databricks landing page, create a new notebook by selecting New Notebook under Common Tasks.
The Azure Databricks landing page displays with New Notebook highlighted beneath the Common Tasks heading.
In the Create Notebook dialog, enter smartmeters as the Name and select Python as the Language, then select Create.
In the Create Notebook dialog, smartmeters is entered as the Name, and Python is selected in the Language drop down.
Note: If your cluster is stopped, you can select the down arrow next to your attached cluster name, and select Start Cluster from the menu, then select Confirm when prompted.
In the first cell of your Databricks notebook (referred to as a paragraph in notebook jargon), enter the following Python code that creates widgets in the notebook for entering your Azure storage account name and key.
# Create widgets for storage account name and key
dbutils.widgets.text("accountName", "", "Account Name")
dbutils.widgets.text("accountKey", "", "Account Key")
Note: Make sure to be aware of any indents. Python treats indentswith specific syntactical meaning.
Now, select the Run button on the right side of the cell and select Run cell.
A cell in a Databricks Notebook is displayed, and the Run menu is visible with Run Cell highlighted in the menu.
When the cell finishes executing, you will see the Account Key and Account Name widgets appear at the top of the notebook, just below the toolbar.
In the Databricks notebook, Account Key and Account Name widgets are highlighted.
You will also notice a message at the bottom of the cell, indicating that the cell execution completed, and the amount of time it took.
A message is displayed at the bottom of the cell indicating how long the command took to execute.
Enter your Azure Storage account key into the Account Key widget text box, and your Azure storage account name into the Account Name widget text box. These values can be obtained from the Access keys blade in your storage account.
The Account Key and Account Name widgets are populated with values from the Azure storage account.
At the bottom of the first cell, select the + button to insert a new cell below it.
The Insert new cell button is highlighted at the bottom of the Databricks cell.
In the new cell, paste the following code that will assign the values you entered into the widgets you created above into variables that will be used throughout the notebook.
# Get values entered into widgets
accountName = dbutils.widgets.get("accountName")
accountKey = dbutils.widgets.get("accountKey")
Run the cell.
Insert a new cell into the notebook and paste the following code to mount your blob storage account into Databricks File System (DBFS), then run the cell.
# Mount the blob storage account at /mnt/smartmeters. This assumes your container name is smartmeters, and you have a folder named smartmeters within that container, as specified in the exercises above.
if not any(mount.mountPoint == '/mnt/smartmeters' for mount in dbutils.fs.mounts()):
  dbutils.fs.mount(
  source = "wasbs://smartmeters@" + accountName + ".blob.core.windows.net/smartmeters",
  mount_point = "/mnt/smartmeters",
  extra_configs = {"fs.azure.account.key." + accountName + ".blob.core.windows.net": accountKey})
Note: Mounting Azure Blob storage directly to DBFS allows you to access files as if they were on the local file system. Once your blob storage account is mounted, you can access them with Databricks Utilities, dbutils.fs commands.
Insert a new cell and paste the code below to see how dbutils.fs.ls can be used to list the files and folders directly below the smartmeters folder.
# Inspect the file structure
display(dbutils.fs.ls("/mnt/smartmeters/"))
Run the cell.
You know from inspecting the files in the storage container that the files are contained within a folder structure resembling, smartmeters/YYYY-DD-MM/HH. You can use wildcards to obfuscate the date and hour folders, as well as the file names, and access all the files in all the folders. Insert another cell into the notebook, paste the following code, and run the cell to load the data from the files in blob storage into a Databricks Dataframe.
# Create a Dataframe containing data from all the files in blob storage, regardless of the folder they are located within.
df = spark.read.options(header='true', inferSchema='true').csv("dbfs:/mnt/smartmeters/*/*/*.csv",header=True)
print(df.dtypes)
Note: In some rare cases, you may receive an error that the dbfs:/mnt/smartmeters/*/*/*.csv path is incorrect. If this happens, change the path in the cell to the following: dbfs:/mnt/smartmeters/*/*/*/*/*.csv
The cell above also outputs the value of the df.dtypes property, which is a list of the data types of the columns added to the Dataframe, similar to the following:
Output from the df.dtypes property is displayed representing each column and type in the dataframe schema.
Note: Do not worry if any of the time columns in the output are represented as strings, rather than timestamps. It is simple to perform this cast if you need to.
Insert another cell and run the following code to view the first 10 records contained in the Dataframe.
df.show(10)
Now, you can save the Dataframe to a global table in Databricks. This will make the table accessible to all users and clusters in your Databricks workspace. Insert a new cell and run the following code.
Now, you will use the %sql magic command to change the language of the next cell to SQL from the notebook’s default language, Python, then execute a SQL command to aggregate the SmartMeter data by average temperature. Paste the following code into a new cell and run the cell:
%sql
SELECT id, COUNT(*) AS count, AVG(temp) AS averageTemp FROM SmartMeters GROUP BY id ORDER BY id
The output from the SQL command should resemble the following table:
Output from executing a SQL statement a Databricks notebook cell using the %sql magic command.
Now, execute the same command in a new cell, this time using Spark SQL so you can save the summary data into a Dataframe. Copy and execute the following code into a new cell:
# Query the table to create a Dataframe containing the summary
summary = spark.sql("SELECT id, COUNT(*) AS count, AVG(temp) AS averageTemp FROM SmartMeters GROUP BY id ORDER BY id")

# Save the new pre-computed table
summary.write.mode("overwrite").saveAsTable("DeviceSummary")
Next, query from this summary table by executing the following query in a new cell:
%sql
SELECT * FROM DeviceSummary
Below the results table, notice the area to change the visualization for the tabular output. Expand the Chart menu and choose the Bar option.
Buttons for displaying tabular results in different formats in Databricks
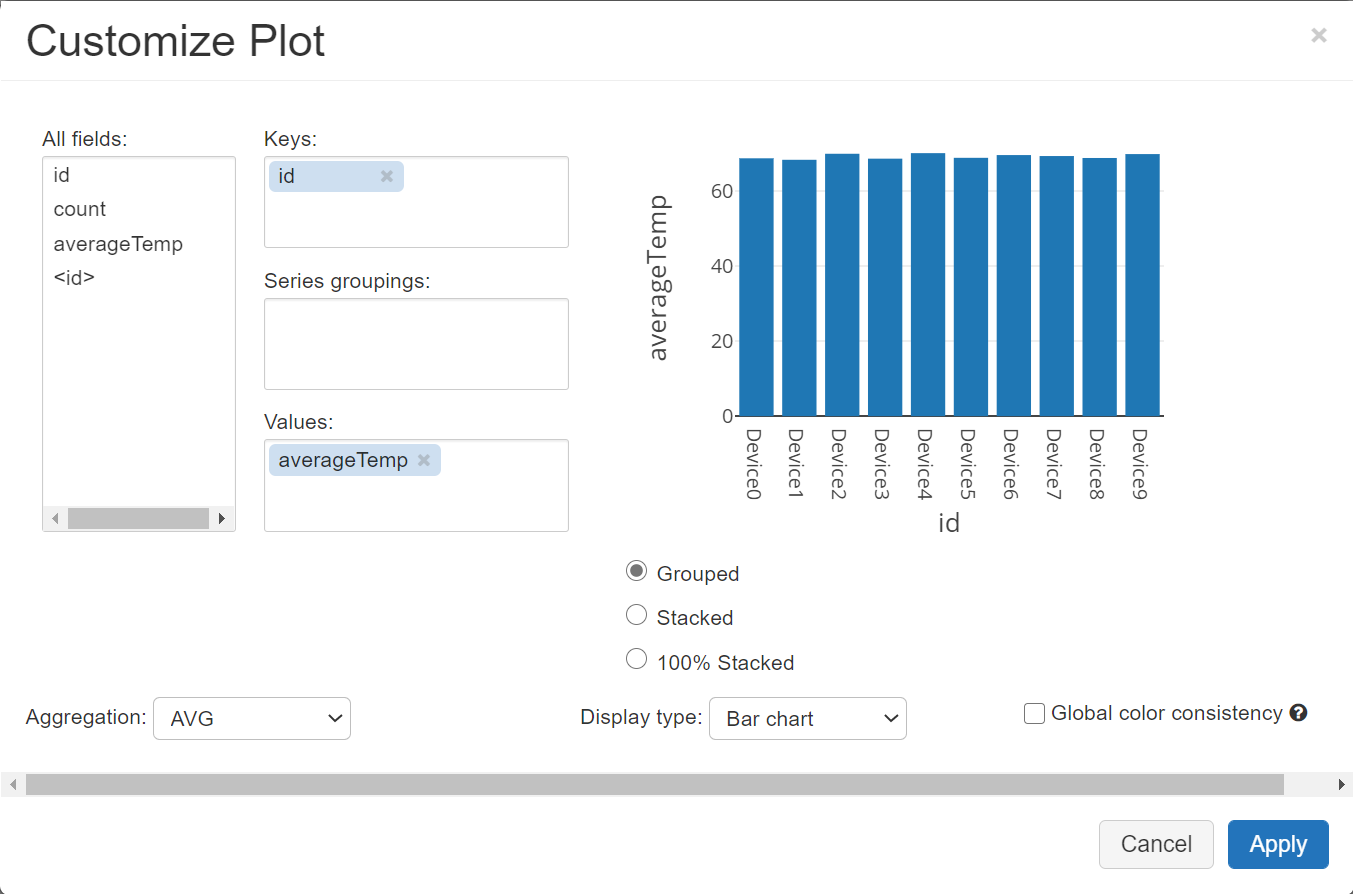
With the Bar chart visualization chosen, a Plot Options.. button appears. Select Plot Options.. and in the Customize Plot dialog, ensure the following are set:
Keys: id
Values: averageTemp
Aggregation: Select AVG.
Select Grouped as the chart type.
Display type: Select Bar chart.
Plot customization options dialog in Azure databricks, with id in the Keys field, averageTemp in the Values field, Aggregation set to AVG, and the chart set to a grouped bar chart.
Select Apply.
Observe the results graphed as a column chart, where each column represents a device’s average temperature.
A bar chart is displayed, with devices on the X axis, and average temperatures on the Y axis.
Exercise 5: Sending commands to the IoT devices
Duration: 20 minutes
Fabrikam would like to send commands to devices from the cloud in order to control their behavior. In this exercise, you will send commands that control the temperature settings of individual devices.
Task 1: Add your IoT Hub connection string to the CloudToDevice console app
This console app is configured to connect to IoT Hub using the same connection string you use in the SmartMeterSimulator app. Messages are sent from the console app to IoT Hub, specifying a device by its ID, for example Device1. IoT Hub then transmits that message to the device when it is connected. This is called a cloud-to-device message. The console app is not directly connecting to the device and sending it the message. All messages flow through IoT Hub where the connections and device state are managed.
Return to the SmartMeterSimulator solution in Visual Studio on your Lab VM.
In the Solution Explorer, expand the CloudToDevice project and open Program.cs. (If the Solution Explorer is not in the upper-right corner of your Visual Studio instance, you can find it under the View menu in Visual Studio.)
In the Visual Studio Solution Explorer window, CloudToDevice is expanded, and under it, Program.cs is highlighted.
Replace YOUR-CONNECTION-STRING on line 13 with your IoT Hub connection string. This is the same string you added to the Main form in the SmartMeterSimulator earlier. The line you need to update looks like this:
After updating, your Program.cs file should look similar to the following:
The Program.cs file has been updated with the code change.
Save the file.
Task 2: Send cloud-to-device messages
In this task, you will leave the simulator running and separately launch the console app to start sending cloud-to-device messages.
If you hover over one of the windows, you will see a dialog display information about the associated device, including the Device ID (in this case, Device0), Device Key, Temperature, and Indicator. The legend on the bottom shows the indicator displayed for each temperature range. The Device ID is important when sending cloud-to-device messages, as this is how we will target a specific device when we remotely set the desired temperature. Keep the Device ID values in mind when sending the messages in the next task.
A dialog containing device information is displayed after hovering over a window.
Within the SmartMeterSimulator Visual Studio solution, right-click the CloudToDevice project, select Debug, then select Start new instance to run the console app.
In the console window, enter a device number when prompted. Accepted values are 0-9, since there are 10 devices whose IDs begin with 0. You can hover over the windows in the Smart Meter Simulator to view the Device IDs. When you enter a number, such as 0, then a message will be sent to Device0. Be certain to select the device number of a registered window!
The value of 0 is entered when prompted for the device number in the console window.
Now enter a temperature value between 65 and 85 degrees (F) when prompted. If you set a value above 72 degrees, the window will turn red. If the value is set between 68 and 72 degrees, it will turn green. Values below 68 degrees will turn the window blue. Once you set a value, the device will remain at that value until you set a new value, rather than randomly changing.
A value of 70 has been entered for the temperature. A new log entry in the Smart Meter Simulator appears in yellow showing the message value of 70 sent to Device0.
If you run the Smart Meter Simulator side-by-side with the console app, you can observe the message logged by the Smart Meter Simulator within seconds. This message appears with a yellow background and displays the temperature request value sent to the device. In our case, we sent a request of 70 degrees to Device0. The console app indicates that it is sending the temperature request to the indicated device.
Hover over the device to which you sent the message. You will see that its temperature is set to the value you requested through the console app.
Device0 is hovered over and the dialog appears showing the temperature set to the requested temperature.
In the console window, you can enter Y to send another message. Experiment with setting the temperature on other devices and observe the results.
Exercise 6: Implement an IoT Edge Gateway
Duration: 80 minutes
An IoT Edge Gateway device provides a connection between other devices on the network and the IoT Hub. Edge Gateway devices can be classified as a transparent or translation gateway.
In a transparent gateway scenario, the IoT Edge hub module itself acts as IoT Hub, it handles connections from other devices that have an identity with the same IoT hub. This type of gateway pattern is called transparent because messages pass from downstream devices to the IoT Hub as though there were not a gateway between them.
A translation gateway provides a connection to the IoT hub for devices that don’t or can’t connect to IoT Hub on their own, such as with devices that communicate over Bluetooth or Zigbee. This type of gateway pattern is called translation because the IoT Edge device has to perform processing on incoming device messages before they can be forwarded to the IoT Hub. These scenarios require additional modules on the IoT Edge gateway to handle the messaging protocol translation..
The transparent and translation gateway patterns are not mutually exclusive. A single IoT Edge device can function as both a transparent gateway and a translation gateway.
In one customer building, Fabrikam would like to establish a transparent IoT Edge Gateway to provide downstream device isolation and to deal with isolated internet outages. In this scenario, all communication from the building’s IoT devices will be sent to IoT Hub via the gateway device, and when there is no internet connection, all telemetry will be held by the gateway device until connectivity is restored.
In this exercise, you will establish the LabVM as an IoT Edge transparent gateway and configure IoT devices to communicate through the gateway.
Task 1: Provision the IoT Edge device with the Azure IoT Hub Device Provisioning Service (DPS)
Earlier in the lab we provisioned smart meter devices at scale using an enrollment group with the Azure IoT Hub Device Provisioning Service (DPS). In this task, we will provision LabVM as an IoT Edge device using an individual enrollment. We will continue to use symmetric key attestation.
Note: Device attestation using a TPM or X.509 certificates is more secure and should be used for more stringent security requirements in production environments.
In the Azure Portal, open the lab resource group and select the smartmeter-dps-{suffix} device provisioning service resource.
From the left menu of the DPS, select Manage enrollments. Then, from the toolbar menu, select + Add individual enrollment.
The DPS resource screen displays with Manage enrollments selected from the left menu and the + Add individual enrollment menu item highlighted in the toolbar menu.
In the Add Enrollment form, populate the following values (leaving the rest as their defaults), then press Save.
Field
Value
Mechanism
Select Symmetric Key.
Registration ID
Enter edge-vm-{SUFFIX}.
IoT Edge device
Select True
The Add Enrollment form displays populated with the preceding values.
On the Manage enrollments screen, select the Individual Enrollments tab, then select the edge-vm-{SUFFIX} registration entry.
The Manage enrollments screen displays with the Individual Enrollments tab selected. The list of individual enrollments displays with edge-vm-{SUFFIX} selected.
On the edge-vm-{SUFFIX} Enrollment Details screen, copy and record the Primary Key value to a text editor.
The edge-vm-{SUFFIX} Enrollment Details screen displays with the copy button highlighted next to the Primary Key value.
Task 2: Deploy a Linux server as an IoT Edge device
The IoT Edge runtime can be installed on various form factors, from small development boards like the Raspberry Pi to industrial-sized servers. Fabrikam desires to deploy a Linux Virtual Machine to serve as the IoT Edge Gateway device.
In the Azure Portal, open the lab resource group and select + Create from the toolbar menu.
In the Search services and marketplace text box, enter and select Ubuntu Server 18.04 LTS from the suggestion list. Then on the resource screen, select Create.
In the Create a virtual machine blade, fill the form as follows then select Review + create. Fields that are not specified can retain their default values.
Field
Value
Virtual machine name
Enter edge-vm-{SUFFIX}.
Authentication type
Select Password.
Username
Enter demouser.
Password
Enter Password.1!!.
Confirm password
Enter Password.1!!.
The Create a virtual machine form displays populated with the aforementioned values.
Once deployment has completed, open the newly deployed edge-vm-{SUFFIX} resource and record the Public IP address value in a text editor.
The Virtual machine overview is displayed with the Public IP address value highlighted.
To setup a host name for the IoT Edge device, select the Not configured link next to the DNS name field.
The edge-vm screen displays with the Not configured link highlighted next to the DNS name label.
On the edge-vm-{SUFFIX}-ip Configuration screen, provide the DNS name label edge-vm-{SUFFIX}. It is important that this value matches the registration ID of the device in DPS. Select Save.
The edge-vm-ip Configuration screen displays with the DNS label set to edge-vm-suffix and the save button is highlighted in the toolbar menu.
Wait a few moments, then return to the edge-vm-{SUFFIX} Overview screen and select Refresh from the toolbar menu. The DNS name value should now be populated with the label you assigned in the previous step.
A portion of the edge-vm Overview screen displays with the DNS name value populated.
In the upper right menu of the Azure Portal, open a cloud shell instance selecting Bash as the language of choice.
The Azure Portal displays with the cloud shell icon highlighted in the top-right toolbar menu and Bash selected as the language.
In the cloud shell, we will SSH into the virtual machine using the IP you recorded. At the Bash prompt, execute the following command, replacing {ipAddress} with the appropriate value.
ssh demouser@{ipAddress}
If prompted to trust the fingerprint, enter yes.
When prompted for a password, enter Password.1!!.
You are now connected to the virtual machine; you can tell by the prompt changing to demouser@edge-vm-{SUFFIX}. All commands executed will now be run on the virtual machine.
The Bash prompt displays demouser@edge-vm-{SUFFIX}.
Install the Microsoft installation packages repository configuration by executing the following.
Copy the key to the trusted location by executing the following command.
sudo cp ./microsoft.gpg /etc/apt/trusted.gpg.d/
Now that the Microsoft package feed has been added and trusted, update the device package list by executing the following command.
sudo apt-get update
Install the Moby container engine by issuing the following command. When prompted to continue, enter Y. This container engine will be used to run IoT Edge modules in the form of Docker containers.
sudo apt-get install moby-engine
Install the IoT Edge runtime by executing the following command. When prompted to continue, enter y.
sudo apt-get install aziot-edge
Create a configuration file from a template that will contain the device identity and Device Provisioning Service information by executing the following command.
Edit the newly created configuration file by issuing the following command.
sudo nano /etc/aziot/config.toml
Using the arrow keys on the keyboard, locate and uncomment the hostname variable. Set its value to the host name you assigned to edge-vm.
A portion of the IoT Edge configuration file is open in nano where the hostname value is set accordingly.
Keeping the configuration file open in nano, find the location of the DPS provisioning with symmetric key section. Uncomment and modify the id_scope, registration id (edge-vm), and symmetric_key (individual device enrollment primary key) values, then exit with saving the file (Ctrl+X, then Y, then press enter).
The IoT Edge configuration file is open in nano with the variables mentioned above replaced accordingly.
Apply the configuration changes by executing the following command.
sudo iotedge config apply
Verify the installation by checking the status of the IoT Edge service.
sudo iotedge system status
Discover installed IoT Edge modules. The edgeAgent module should be listed with a status of running.
sudo iotedge list
A Bash window displays with the sudo iotedge list command executed. The edgeAgent module displays as running.
In the Azure Portal, open the lab resource group and select the smartmeter-hub-{SUFFIX} IoT Hub. Verify the IoT Edge device successfully registered through the DPS by selecting IoT Edge from the left menu and finding edge-vm-{SUFFIX} in the listing.
The IoT Hub screen displays with IoT Edge selected from the left menu and edge-vm highlighted in the IoT Edge Devices listing.
In order for downstream devices to communicate with the IoT Edge Gateway using the AMQP protocol, port 5671 needs to be opened in the Ubuntu firewall. Open port 5671 by executing the following command in the cloud shell.
sudo ufw allow 5671
Keep the cloud shell window open and connected to the edge-vm via ssh for the next task.
In the Azure Portal, open the lab resource group and select the edge-vm-{SUFFIX}-nsg Network security group.
From the left menu, select Inbound security rules, then + Add.
The edge-vm-nsg resource screen displays with Inbound security rules selected from the left menu and the + Add button highlighted in the toolbar menu.
In the Add inbound security rule blade, fill the form as follows and select Add. Fields not mentioned retain their default value.
Field
Value
Destination port ranges
Enter 5671.
Name
Enter AMQP.
The Add inbound security rule blade displays populated with the aforementioned values.
Task 3: Generate test certificates for downstream device connectivity
It is a requirement that downstream devices authenticate to the IoT Edge Gateway using certificates. In this task, you will create test certificates and ensure proper authentication between downstream devices and the gateway device.
The Azure/iotedge GitHub project contains scripts to generate non-production certificates. Clone the repository by executing the following command:
git clone https://github.com/Azure/iotedge.git
Create a directory to hold the necessary certificates.
mkdir certificates
Move to the new directory.
cd certificates
Copy the necessary scripts from the GitHub repository.
cp ../iotedge/tools/CACertificates/*.cnf .
then
cp ../iotedge/tools/CACertificates/certGen.sh .
Leverage the helper script to generate the root CA certificate and one intermediate certificate.
./certGen.sh create_root_and_intermediate
Leverage the helper script to create the IoT Edge device CA certificate.
Continuing in the same file, locate the [edge_ca] section, uncomment and replace the values as follows, then save and exit while saving the file (Ctrl+X, then Y, then press enter):
You will be prompted for the password: Password.1!!.
Download the root certificate to a known location by selecting the Upload/Download files button on the cloud shell toolbar menu and chooseg Download from the expanded menu options.
The cloud shell toolbar displays with the Upload/Download files button highlighted.
In the Download a file dialog, set the path to the following value, this will download the file from the browser. We will be using this file later in this lab.
Task 4: Configure the IoT Edge Device as a Gateway in IoT Hub
To configure edge-vm as an IoT Edge Gateway the $edgeHub IoT Edge module needs to be configured by having its routing defined. The route defined will be setup to forward all downstream device messages to IoT Hub. IoT Edge modules can be configured and deployed to devices via the IoT Hub.
In the Azure Portal, open the lab resource group and select the smartmeter-hub-{SUFFIX} IoT Hub resource.
From the left menu, select IoT Edge, then select edge-vm-{SUFFIX} from the list of devices. Notice that the IoT Edge Runtime response indicates the deployment configuration is not set, and the $edgeHub module is not running - this will soon change.
On the edge-vm-{SUFFIX} screen, select Set modules from the top toolbar menu.
The edge-vm screen displays with the Set modules button highlighted in the toolbar menu.
On the Set modules on device: edge-vm-{SUFFIX} screen, select the Routes tab and establish the following route. Once complete, select Review + Create, then Create on the review screen.
Route Name
Route Value
Description
allDownstreamToIoTHub
FROM /messages/* WHERE NOT IS_DEFINED ($connectionModuleId) INTO $upstream
When a message is received from a downstream device, the $connectionModuleId value is blank. The $connectionModuleId value is only set on messages originating from other IoT Edge modules. This route value filters all messages and forwards on those originating from downstream devices.
The Set Modules screen displays with the Routes tab selected and the preceding route.
Wait a few moments and refresh the edge-vm-{SUFFIX} screen. Note that the IoT Edge Runtime Response now displays 200 – OK and the $edgeHub module is now running (you may need to refresh a few times to see the $edgeHub module running successfully).
The edge-vm screen displays with the IoT Edge Runtime Response displaying a status of 200 and the $edgeHub module displays as running.
Task 5: Update the device client to communicate through the IoT Edge Gateway
Individual downstream device clients need to be configured to communicate directly through the IoT Edge Gateway device rather than to the IoT Hub directly. In this task, the meters located in the second (right) building of the simulator will be configured to send telemetry through the IoT Edge transparent gateway. These are Devices 7, 8, and 9.
In the Azure Portal, open the lab resource group and locate and select the smartmeter-hub-{SUFFIX} IoT Hub.
From the left menu, select IoT devices.
From the list of IoT devices, select Device7.
The smartmeter-hub-{SUFFIX} IoT devices screen displays with IoT devices selected in the left menu and Device7 highlighted in the list of devices.
Assign edge-vm-{SUFFIX} as the parent device. This will allow this device to communicate through the IoT Edge transparent gateway. Select the cog icon next to the Parent device field.
The IoT device screen displays with the cog icon selected next to the Parent device field label.
On the Set an IoT Edge device as parent device screen, select edge-vm-{SUFFIX} from the listing, then select OK.
The Set an IoT Edge device as parent device screen displays with edge-vm-{SUFFIX} selected and the OK button is highlighted.
Select Save on the IoT Device screen to commit the changes.
The IoT device screen displays with the Save button selected in the toolbar menu. The populated Parent device field is highlighted.
Repeat steps 1-6 for Device8 and Device9.
In Visual Studio, open the Sensor.cs file from within the SmartMeterSimulator.
Locate the line //TODO: 6. Connect the Device to Iot Hub by creating an instance of DeviceClient and add the gateway hostname as the second parameter. This parameter will route all messages to the IoT Edge Gateway.
A code snippet displays with the IoT Edge Gateway hostname string value highlighted.
Locate //TODO: 12 - Install and trust IoT Edge Gateway root certificate in the DeviceManager.cs file and replace it with the following listing. This code will trust the root certificate of the IoT Edge gateway device. Replace {CERTPATH} with the full path to the certificate you downloaded from the cloud shell earlier. This method is called every time the application is run (MainForm.cs in the MainForm constructor).
//TODO: 12 - Install and trust IoT Edge Gateway root certificate
string trustedCACertPath = @"{CERTPATH}";
if (!string.IsNullOrWhiteSpace(trustedCACertPath))
{
    if (!File.Exists(trustedCACertPath))
    {
        // cannot proceed further without a proper cert file
        throw new InvalidOperationException("Invalid certificate file.");
    }
    else
    {
        X509Store store = new X509Store(StoreName.Root, StoreLocation.CurrentUser);
        store.Open(OpenFlags.ReadWrite);
        store.Add(new X509Certificate2(X509Certificate.CreateFromCertFile(trustedCACertPath)));
        store.Close();
    }
}
Run the application, select all three windows in the second building (on the right in the simulator) and choose Register. Once the windows display as cyan, select the Connect button for the devices to start sending telemetry through the IoT Edge Gateway.
The Smart Meter Simulator displays with multiple smart meters sending telemetry.”
Note: You may be prompted to install the IoT Edge Gateway certificate, select Yes if this occurs.
A Security Warning dialog displays regarding installation of a certificate.
Now it’s time to verify telemetry is being sent to IoT Hub. In Visual Studio, expand the View menu and choose Cloud Explorer.
Expand the subscription being used for this lab and expand the IoT Hubs node. Right-click on smartmeter-hub-{SUFFIX} to display the context menu and select the Start Monitoring Built-in Event Endpoint item.
The Cloud Explorer displays with a subscription expanded along with the IoT Hubs node. The smartmeter-hub-{SUFFIX} has its context menu expanded with the Start Monitoring Built-in Event Endpoint item selected.
The Output panel will start displaying IoT Hub events including telemetry events.
The Output pane displays with incoming telemetry events.
After the hands-on lab
Duration: 10 mins
In this exercise, you will delete any Azure resources that were created in support of the lab. You should follow all steps provided after attending the Hands-on lab to ensure your account does not continue to be charged for lab resources.
Task 1: Delete the resource group
Using the Azure portal, navigate to the Resource group you used throughout this hands-on lab by selecting Resource groups in the left menu.
Search for the name of your research group and select it from the list.
Select Delete in the command bar and confirm the deletion by re-typing the Resource group name and selecting Delete.
You should follow all steps provided after attending the Hands-on lab.